What is the Average House Price in Orangeville?
Housing Market Report for April 2025
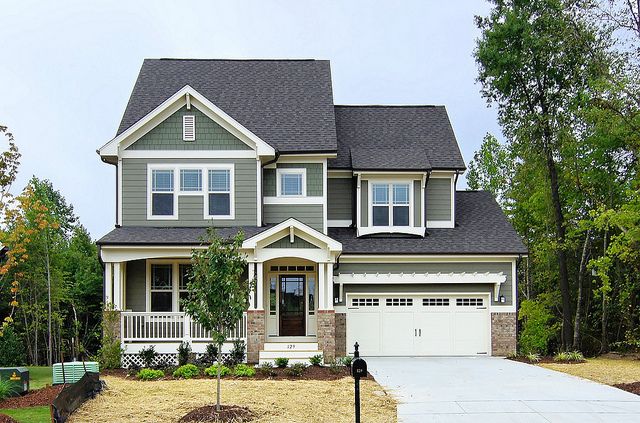
Answer: The average price of a house in Orangeville is $756,707 with 796 new listings appearing in the past 28 days. The data on Orangeville’s housing market reveals that the median time a property spends on the market is 31 days according to current Orangeville MLS® stats.
Orangeville Housing Stats
Mar 07 – Apr 04
$757K
Avg Sold Price
$566
Median $/Sq.Ft
16%
Monthly Change
7.1%
Quarterly Change
9.2%
Yearly Change
| # Beds | Mar 07 – Apr 04 | 3 mo ago | 6 mo ago | 1 year ago |
|---|---|---|---|---|
| 2 Bd | $825K +14% | $875K | n/a | $725K |
| 3 Bd | $834K -6% | $960K | $882K | $886K |
| 4 Bd | $937K -20% | $1.1M | $1.0M | $1.2M |
| 5 Bd | n/a | n/a | n/a | n/a |
| 6 Bd | n/a | n/a | n/a | n/a |
| All | $838K -11% | $929K | $894K | $941K |
| # Beds | Mar 07 – Apr 04 | 3 mo ago | 6 mo ago | 1 year ago |
|---|---|---|---|---|
| 1 Bd | n/a | n/a | n/a | n/a |
| 2 Bd | n/a | $542K | $562K | $659K |
| 3 Bd | $592K -15% | $725K | $647K | $694K |
| 4 Bd | $694K -14% | n/a | $831K | $805K |
| All | $643K -8% | $603K | $653K | $702K |
| # Beds | Mar 07 – Apr 04 | 3 mo ago | 6 mo ago | 1 year ago |
|---|---|---|---|---|
| Studio | n/a | n/a | n/a | n/a |
| 1 Bd | $410K -4% | $490K | n/a | n/a |
| 2 Bd | $500K -18% | $519K | n/a | $613K |
| 3 Bd | n/a | n/a | n/a | $590K |
| All | $440K -28% | $505K | n/a | $607K |
Orangeville Housing Inventory
79
new listings
(last 28 days)
30
homes sold
(last 28 days)
31
average days on market
98%
selling to listing ratio
| # Beds | New Listings | Sold Listings | Active Listings | Days on Market | Sale to List |
|---|---|---|---|---|---|
| 2 Bd | 2 0% | 1 0% | 2 0% | n/a | n/a |
| 3 Bd | 30 -40% | 17 -19% | 50 -12% | n/a | 97.87% -2% |
| 4 Bd | 12 -29% | 2 -67% | 21 +11% | n/a | n/a |
| 5 Bd | 2 -60% | 0 | 2 -33% | n/a | n/a |
| 6 Bd | 0 | 0 | 1 -50% | n/a | n/a |
| All | 46 -39% | 21 -25% | 77 -8% | 25 +29% | 98.13% -1% |
| # Beds | New Listings | Sold Listings | Active Listings | Days on Market | Sale to List |
|---|---|---|---|---|---|
| 1 Bd | 1 | 0 | 1 | n/a | n/a |
| 2 Bd | 0 -100% | 0 -100% | 0 -100% | n/a | n/a |
| 3 Bd | 9 -44% | 3 -75% | 15 -12% | n/a | 97.53% |
| 4 Bd | 4 +33% | 3 +200 | 5 +25% | n/a | n/a |
| All | 14 -46% | 6 -63% | 24 -11% | 47 +81% | 95.33% -3% |
| # Beds | New Listings | Sold Listings | Active Listings | Days on Market | Sale to List |
|---|---|---|---|---|---|
| Studio | 0 | 0 | 0 | n/a | n/a |
| 1 Bd | 1 -67% | 2 | 3 -40% | n/a | n/a |
| 2 Bd | 4 -33% | 1 -67% | 12 +20% | n/a | n/a |
| 3 Bd | 1 0% | 0 -100% | 1 | n/a | n/a |
| All | 6 -40% | 3 -25% | 16 +7% | n/a | n/a |
Orangeville Rankings out of 23 in Greater Toronto
23rd
Most expensive
6th
Fastest Growing
21st
Fastest Selling
24th
Highest Turnover

Jennifer Jewell Get in touch with Jennifer here.